
Guides · Analytics
See where your money goes with Cyclar
Move past "I think I spent a lot" to a clear view of net cashflow, category breakdowns, and the merchants behind the charts.
The problem
A vague sense of spending is not a useful answer.
Most people know money came in and money went out. Fewer can say whether the month was ahead or behind, which categories drove it, or which merchants quietly added up.
Without that detail, you can stay busy managing bills and still feel unsure about the bigger pattern.
How Cyclar helps
Analytics turns your data into a readable story.
Because you maintain your own bills and income in Cyclar, Analytics reflects a picture you trust: not a noisy bank feed, but the cashflow you chose to track.
-
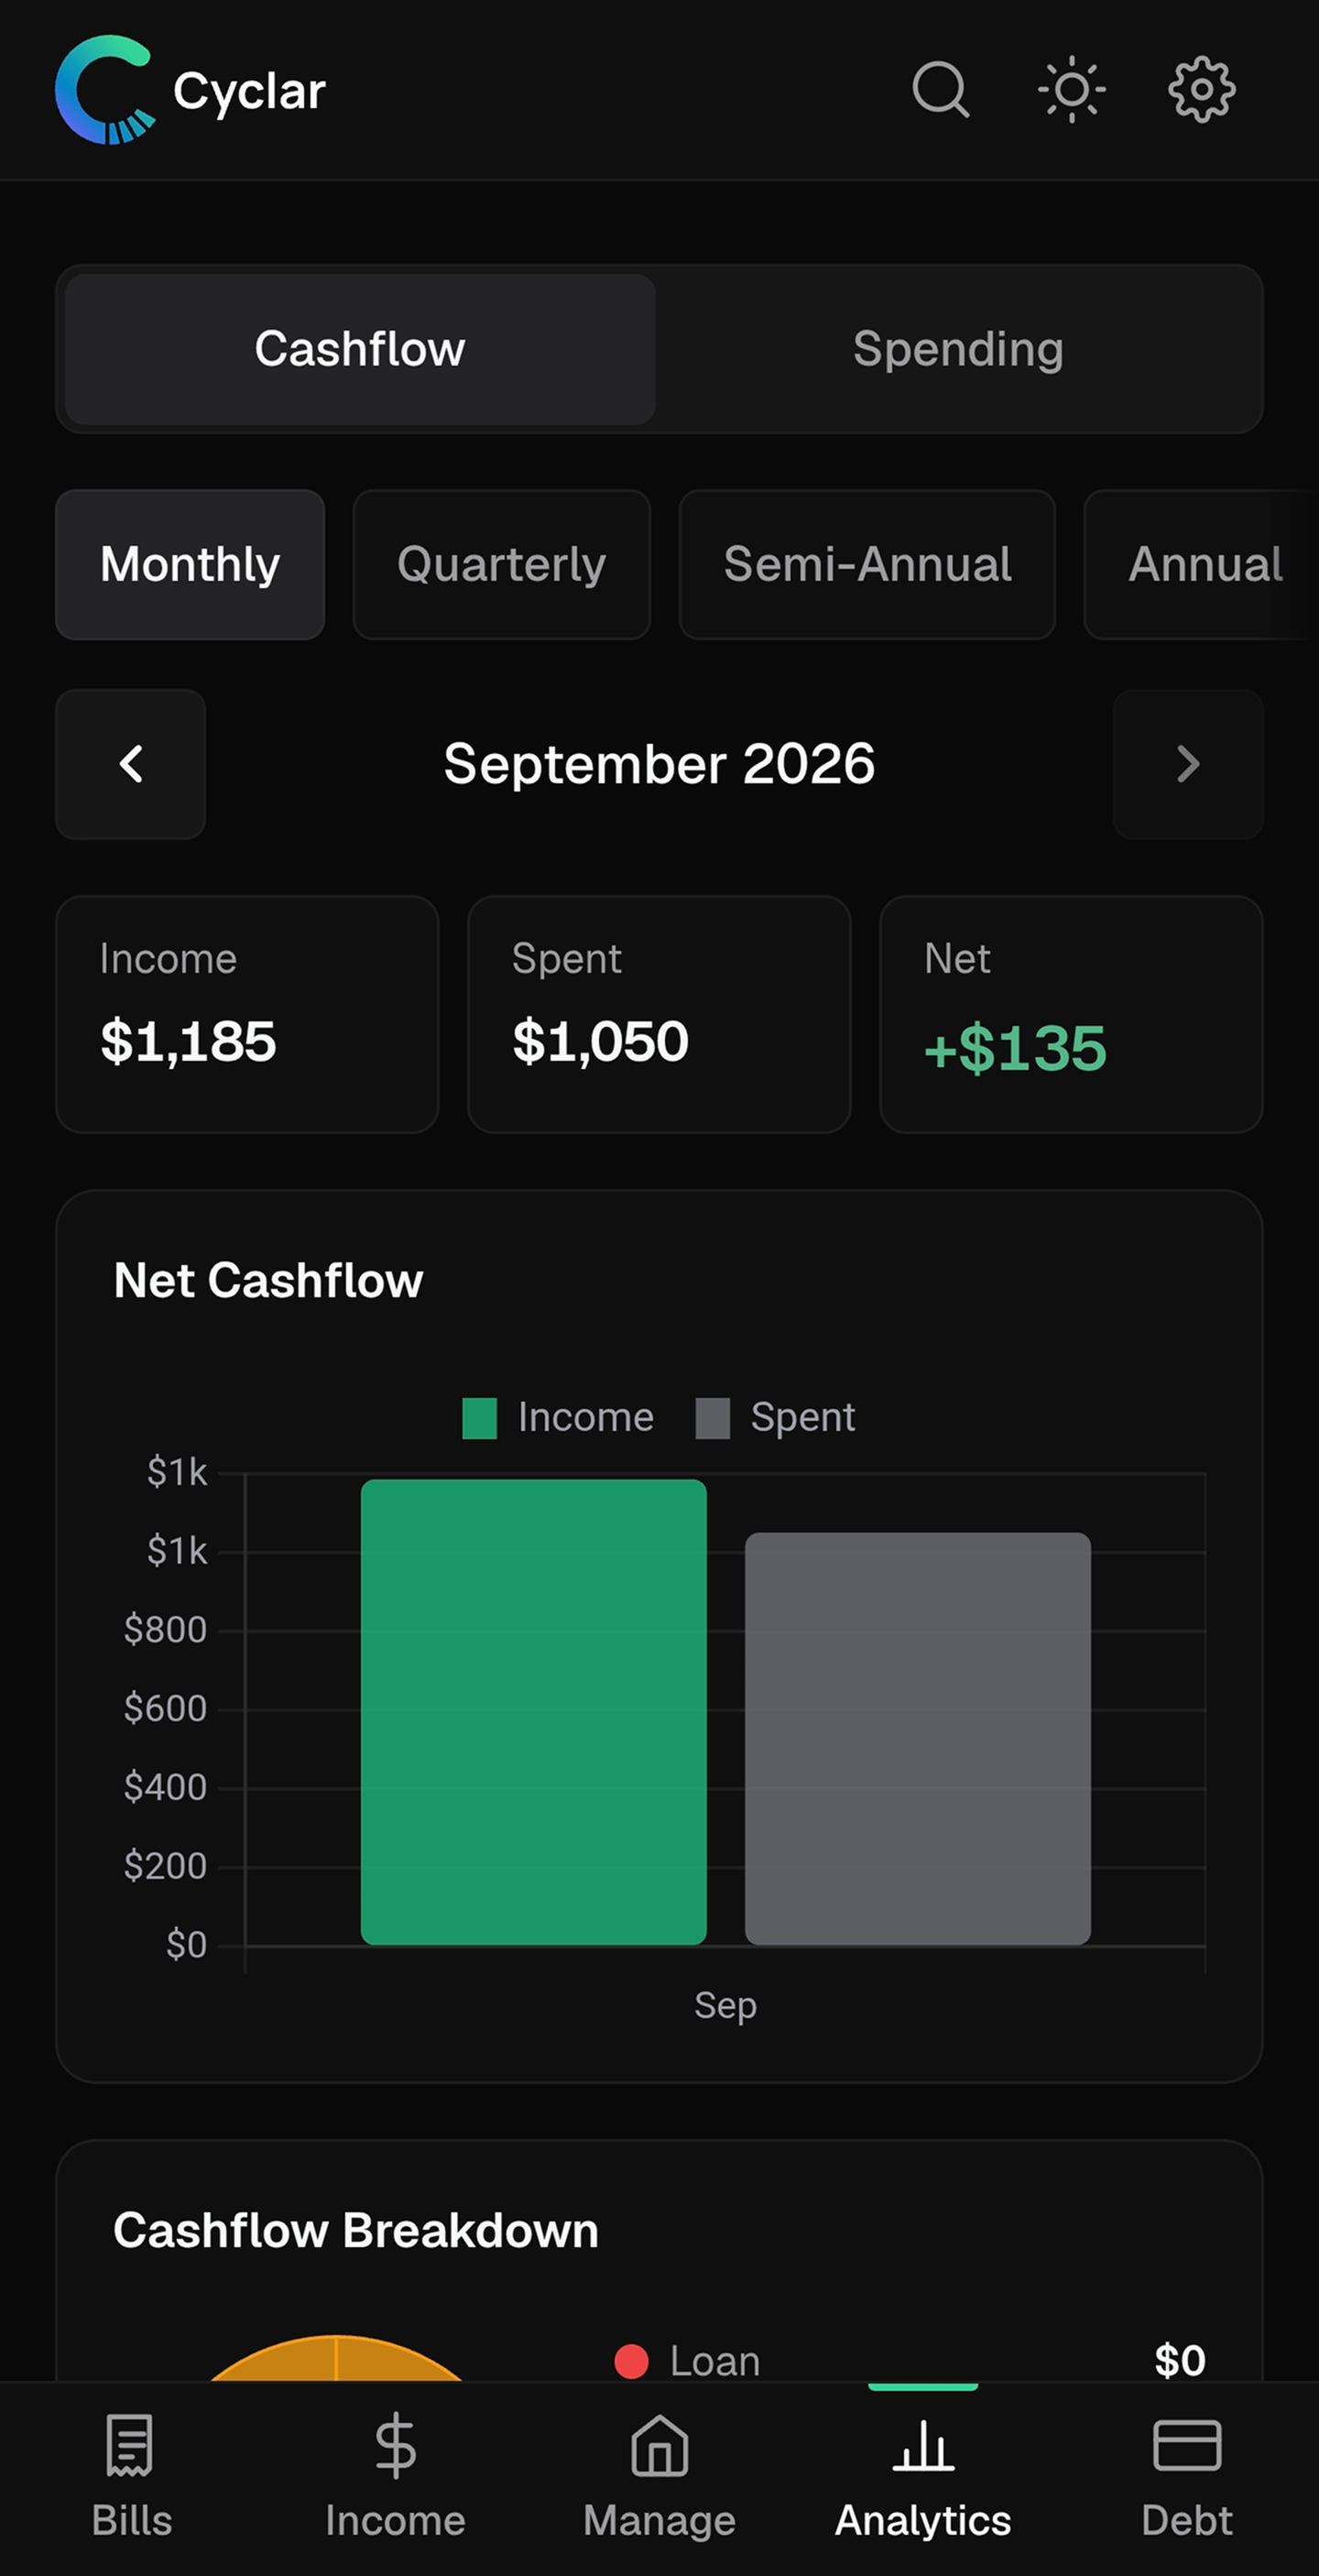
Net cashflow
See income versus bills over time so you know whether you are ahead, flat, or behind across the range you care about.
-
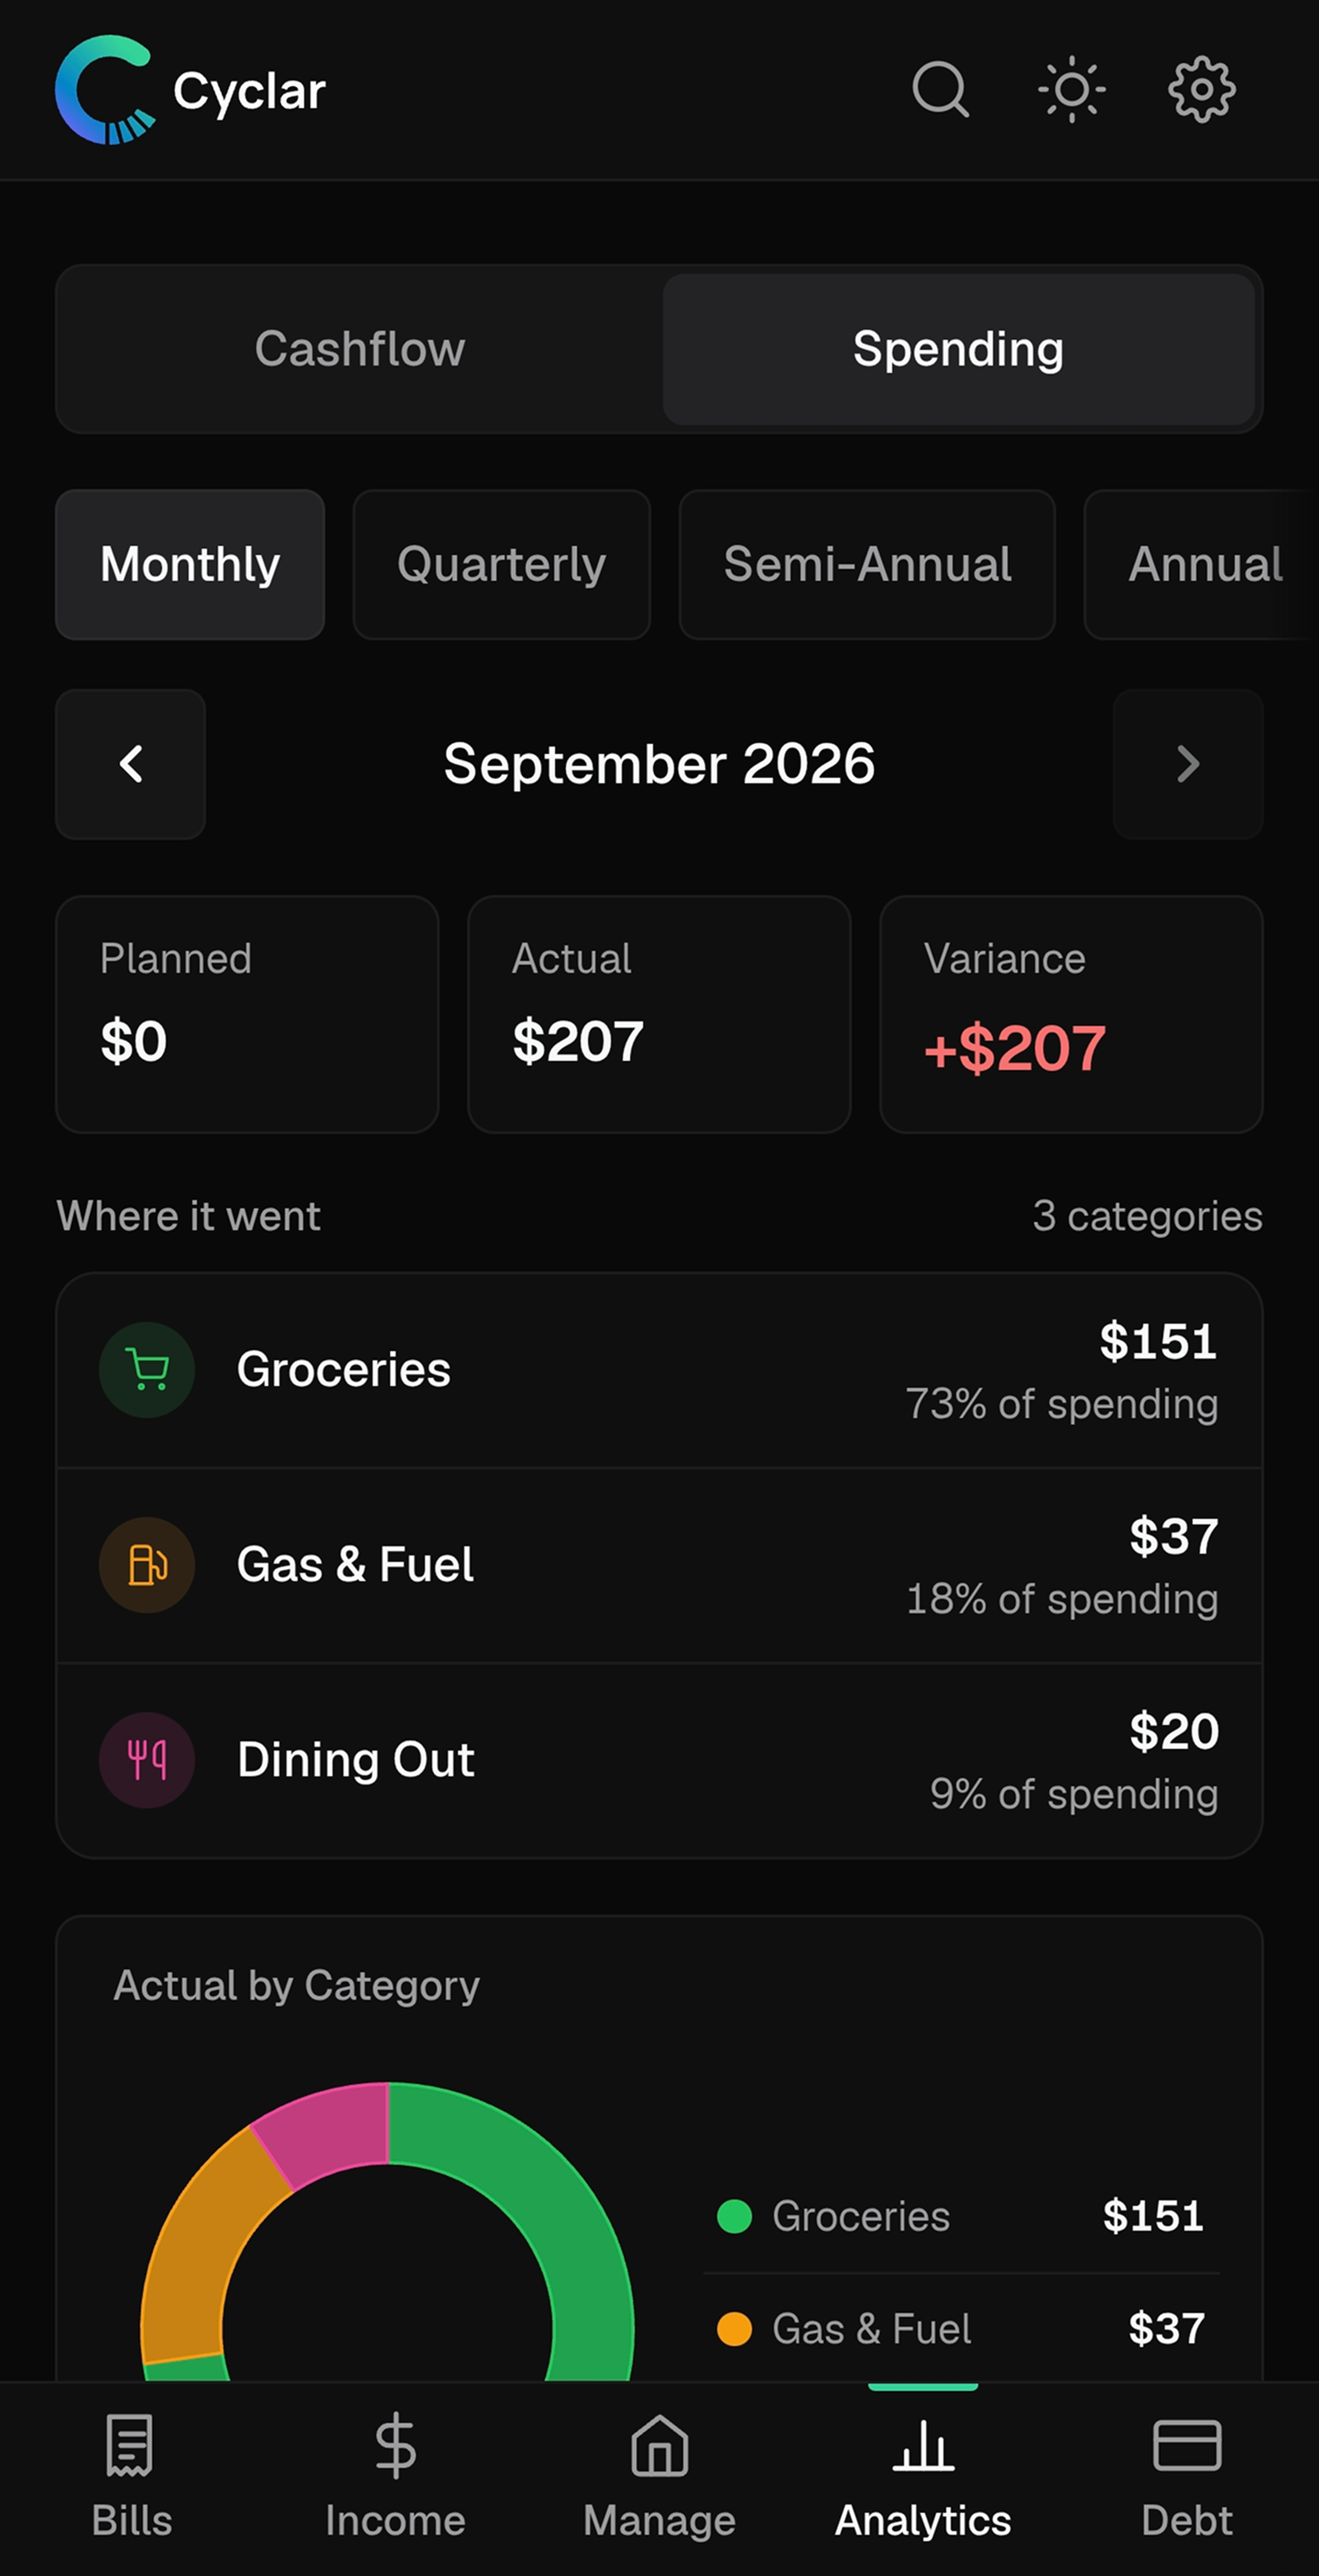
Spending by category
Break spending into categories that match how you organized your bills, so the chart maps to real decisions.
-
Drill to merchants
Tap into a chart to inspect the underlying activity, down to individual merchants when you need the why behind a spike.
How to do it
Use Analytics after you have a few weeks of data.
-
Keep bills and income current
Analytics is only as clear as the data underneath. Maintain recurring bills and income so the charts stay meaningful.
-
Start with net cashflow
Ask the simple question first: are you ahead or behind over this period? That frames everything else.
-
Open the spending breakdown
Find which categories moved the needle. Look for patterns you can change, not just totals that feel large.
-
Drill when something looks off
Tap into the chart and inspect merchants or transactions. Clarity comes from the detail, not the summary alone.
Understand the pattern, not just the moment.
Try Cyclar free for 30 days. No bank linking. No credit card required.
Try free for 30 daysNo card required · Cancel anytime